
Inflation, wages, and the divide between economic statistics and everyday financial life.
For many Americans, the economy is experienced not through Wall Street headlines but at the grocery checkout, when insurance renewals arrive, and when paychecks no longer stretch as far.
That raises a question: If inflation improves, why does everything still feel so expensive? The answer begins with understanding what inflation measures—and what it does not.
Get The Balanced Report—free in your inbox.
Subscribe for new articles on the economy, politics, and everyday life—without the party talking points. Free to join. Unsubscribe anytime.
Continue reading — no signup required.
Inflation Is Still a Problem
According to the Bureau of Labor Statistics’ September 2026 Consumer Price Index report, released October 14, consumer prices rose 3.7% over the preceding 12 months, compared with 3.4% in August. The index rose 0.6% in September on a seasonally adjusted basis, with gasoline accounting for more than half that monthly increase. Gasoline prices increased 9.1% for the month, while the broader energy index increased 5.2%. The index excluding food and energy rose 2.6% over the year.
Different categories can move in different directions. Inflation can also accelerate after a period of slowing. A single statistic does not describe every household’s experience.
Lower Inflation Does Not Mean Lower Prices
Imagine that a family’s usual groceries once cost $150. After a 20% increase, they cost $180. If those same purchases then increase by 2%, the total becomes $183.60—not $150.
Lower inflation generally means prices are rising more slowly. It does not reverse previous increases. Some individual prices can fall even while the overall price level continues to rise. A broad, sustained decline in the overall price level is called deflation.

Are Paychecks Keeping Up?
When wages grow faster than prices, purchasing power generally improves. When prices rise faster, it weakens. Economists call this change in purchasing power real wage growth.
The Bureau of Labor Statistics reported that real average hourly earnings for private-sector employees fell 0.7% between September 2025 and September 2026. Real average weekly earnings declined 0.1% over that period. These are national averages, not the experience of every worker, and they do not account for every source of household income.
Still, they help explain why a larger paycheck in dollar terms may not feel like financial progress.
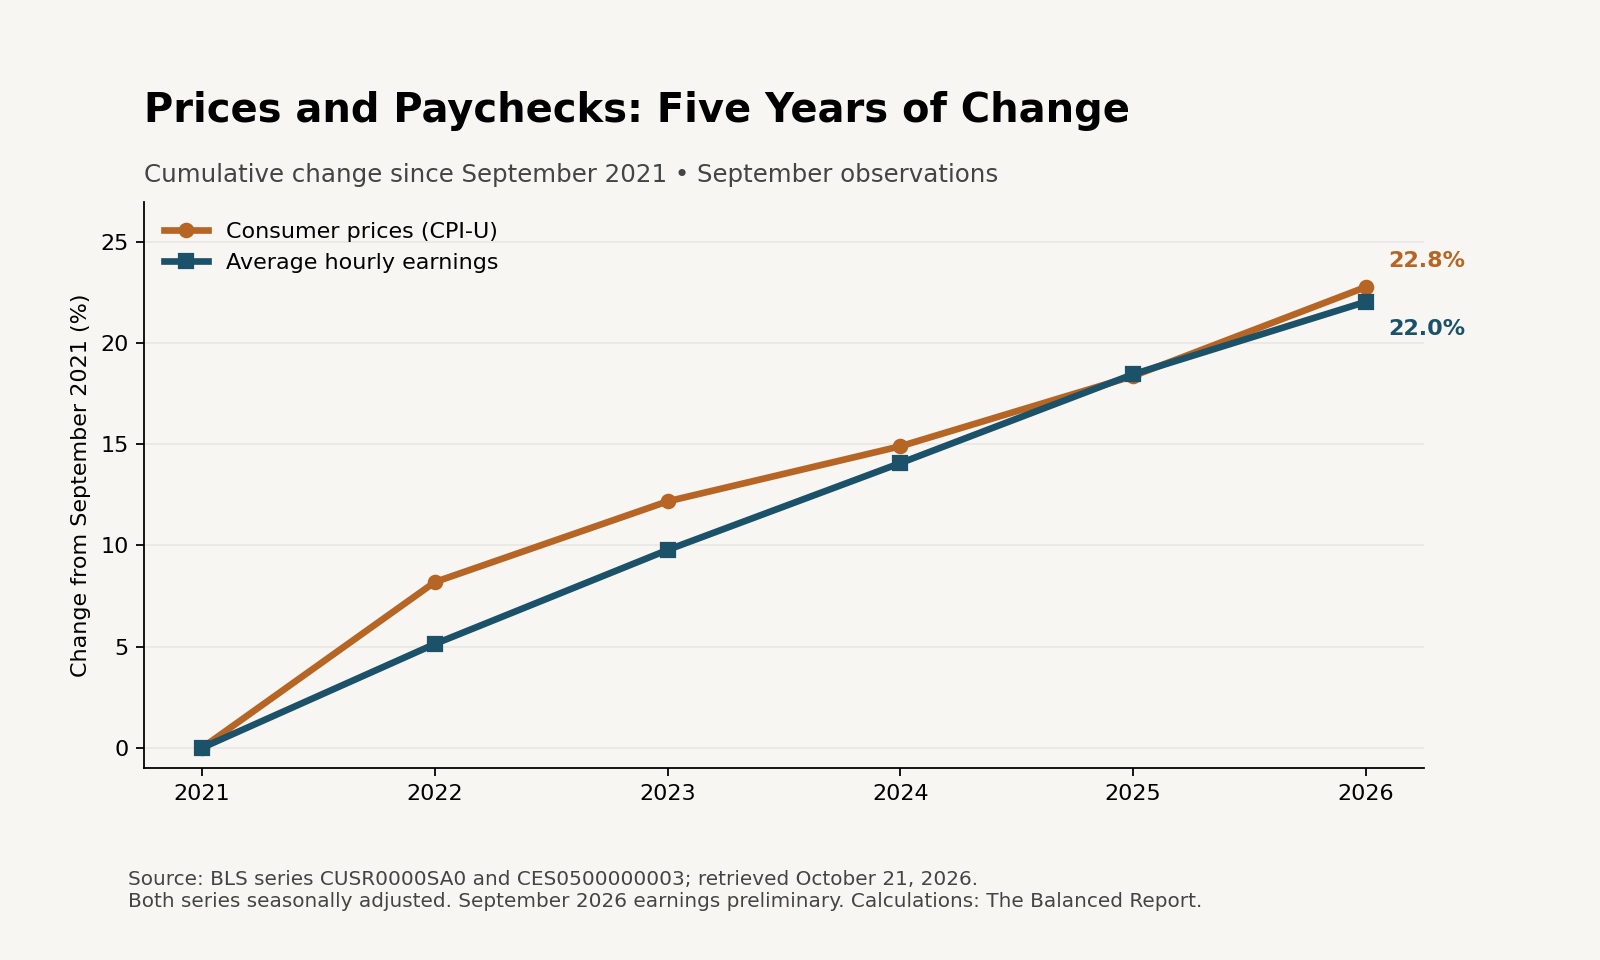
Five Years of Prices Versus Paychecks: A Year-by-Year Comparison
Comparing September with September each year shows what a single five-year total can conceal: average hourly purchasing power fell in 2022, recovered toward its starting point over the following three years, then slipped again in 2026. The comparison below uses one current BLS series for prices and one for average private-sector hourly earnings, with both seasonally adjusted and retrieved on the same date.
| September | CPI-U | Hourly pay | Prices since 2021 | Pay since 2021 | Real pay since 2021 |
|---|---|---|---|---|---|
| 2021 | 273.910 | $30.98 | 0.0% | 0.0% | 0.0% |
| 2022 | 296.349 | $32.57 | +8.2% | +5.1% | -2.8% |
| 2023 | 307.276 | $34.01 | +12.2% | +9.8% | -2.1% |
| 2024 | 314.732 | $35.34 | +14.9% | +14.1% | -0.7% |
| 2025 | 324.245 | $36.70 | +18.4% | +18.5% | +0.1% |
| 2026 | 336.298 | $37.81 | +22.8% | +22.0% | -0.6% |
In September 2022, prices were about 8.2% above September 2021, while average hourly pay had risen 5.1%. After adjusting for inflation, average hourly purchasing power was approximately 2.8% lower than at the starting point.
By September 2025, average hourly purchasing power had recovered to roughly its September 2021 level. In September 2026, prices were 22.8% higher and average hourly pay was 22.0% higher than five years earlier. The resulting inflation-adjusted change was approximately −0.6%. That is a modest decline in the national average, not evidence that every worker lost purchasing power.
Real pay change is calculated by dividing the earnings growth factor by the price growth factor, then subtracting one. Simply subtracting the two displayed percentage increases would give a different result.
For a simple illustration, a hypothetical $150 basket of goods and services in September 2021 would cost approximately $184.17 at the September 2026 price level in this seasonally adjusted comparison. This describes the broad CPI basket; it does not estimate any particular family’s grocery bill.
Important limits: These figures measure average private-sector hourly earnings, not median household income or the pay of the same workers followed over time. Changes in the mix of jobs can affect the average. Work hours, taxes, benefits, housing circumstances, and local costs also affect household finances. CPI-U represents an overall consumer basket. Seasonal adjustment, earnings revisions, and preliminary observations can change historical comparisons; using a consistent current series avoids mixing release vintages.
Why the Same Economy Feels Different to Different Families
Consider two hypothetical households earning $80,000 a year before taxes. For illustration, assume each receives $5,000 a month after taxes and payroll deductions. That take-home amount is an assumption, not a tax estimate. One household has a mortgage obtained years ago; the other rents and carries debt. Their incomes match, but their financial breathing room does not.
| Monthly budget | Household A: established homeowner | Household B: renter with debt |
|---|---|---|
| Assumed take-home income | $5,000 | $5,000 |
| Housing | $1,100 | $1,900 |
| Utilities and communications | $400 | $400 |
| Groceries | $700 | $700 |
| Transportation | $500 | $500 |
| Healthcare out of pocket | $250 | $250 |
| Debt payments, excluding housing | $0 | $450 |
| Other essentials | $350 | $350 |
| Total listed expenses | $3,300 | $4,550 |
| Remaining before saving and unlisted costs | $1,700 | $450 |
The difference is $1,250 a month, or $15,000 a year, entirely from the housing and debt assumptions in this example. Household A has more capacity to save or absorb a repair bill; Household B has less room for the same surprise expense. Homeownership also brings maintenance costs that can narrow that gap.
This does not mean homeowners always fare better than renters. It shows why the same wage increase or national inflation rate can have different consequences depending on existing commitments. Affordability depends on what households earn, what they must spend, and what remains.
Who Is Responsible for High Prices?
Inflation is frequently reduced to a political argument. Government spending, taxes, tariffs, regulation, energy policy, supply disruptions, competition, business pricing, and consumer demand can all influence costs. Their importance varies by period and industry.
The Federal Reserve influences borrowing costs and economic demand through monetary policy, but it does not directly set supermarket prices. Its longer-run 2% inflation objective is defined using the Personal Consumption Expenditures (PCE) price index, not the Consumer Price Index (CPI) discussed above.
Evaluating responsibility requires examining specific policies, evidence, and timing—not assuming every price increase has a single cause.
The Balanced Report Perspective
Lasting improvement would mean household incomes growing faster than necessary expenses, with enough left for saving, debt repayment, and unexpected bills. That can happen without prices returning to their old levels.
National growth and financial markets matter, but so do housing commitments, insurance bills, work hours, and debt. The September data show renewed pressure on average purchasing power; the household example shows why that pressure is uneven.
The test is practical: Does an ordinary paycheck leave enough room to build a stable financial life? That is what it means for economic progress to reach home.
Join the Conversation
Which expense has placed the greatest pressure on your household budget? Groceries, housing, insurance, healthcare, transportation, or something else? Share your perspective in the comments. Respectful disagreement is welcome.
Keep the conversation going.
Subscribe free to receive The Balanced Report’s new articles by email. Thoughtful perspectives, clear explanations, and sources you can check. Unsubscribe anytime.
Sources and Further Reading
- Bureau of Labor Statistics — Consumer Price Index, September 2026
- Bureau of Labor Statistics — Real Earnings, September 2026
- BLS — CPI-U, all items, seasonally adjusted (CUSR0000SA0); select 2021–2026 for the September observations
- BLS — Average hourly earnings of all employees, total private, seasonally adjusted (CES0500000003); select 2021–2026 for the September observations
- BLS API — Price observations used in the table (2021–2026)
- BLS API — Earnings observations used in the table (2021–2026)
- Federal Reserve — Inflation and the PCE price index
The Balanced Report — Real Facts. Thoughtful Perspectives. A Brighter Tomorrow.

Leave a Reply